Sunday, December 30, 2012

"The 4-Hour Work Week" - Thoughts on the Best Selling Book

In a best selling book "The 4-Hour Work Week", author Tim Ferriss argues for working less and experiencing life more.  While this concept is intriguing and what many corporate types long for, I was curious if and how Mr. Ferriss' ideas could convert over to academia.


In academics, many of us (myself included) enjoy what we do and spend much much more than 40 hours a week "working".  While we may not always be in the lab or in the office, we generally think about problems all day, all night, etc.  Why do we do this? Is it because we are addicted to work? Not really, we do it because of an intense interest and desire to solve problems.  You may think that this automatically throws the concepts of the book entirely out the door, which is incorrect! Tim Ferriss admits that he really does work more than 4 hours a week, but his main argument is cutting unnecessary things out of your schedule.

The concept of "work for work's sake" is hammered throughout the book as something to instantly eliminate.  Do you have items that you do to avoid tackling the big projects? For example, sending out a dozen "check up" emails that don't really need to be sent or could be addressed with a short face-to-face kills an hour or so and helps you avoid doing real items that are important but difficult.  This concept can come right on over to academics and graduate students are famous for ninja like procrastination skills.
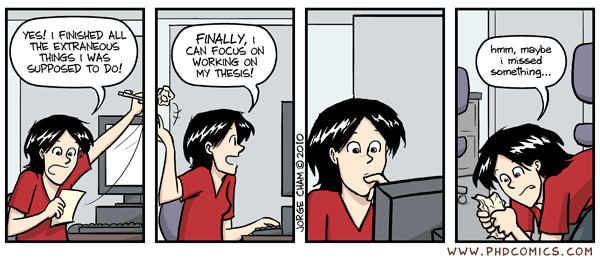

To achieve the freedom described in the book , Ferriss outlines a plan on starting a business, automating it, and letting it produce income with minimum input from you... Sound too good to be true? It probably is and certainly doesn't sound like academia, but with some adapting I think we can focus it down and maybe consider a few of the sub-points in detail.

Starting a business to market a product: not so applicable to graduate students, we make ideas and concepts that can't be outsourced or sold. Later if your idea becomes a product, instrument, etc? Maybe. Overall I'd say this part isn't very applicable and you'll never have to worry about distribution houses and merchant accounts.

Automation: YES! This is something that many graduate students, professors, and even undergraduates can use more of.  My motto is "if you have to do it more than 10 times, write a program".  In some cases that is overkill, but a few simple things like automating your email rules, writing a data plotting routine instead of pointing and clicking to make the same plots, or even automating bill pay can save you enormous amounts of time.

First off for email: my personal plan follows the David Allen "Getting Things Done" philosophy of inbox zero.  At the end of everyday when I leave for home my inbox (electronic and physical) has exactly zero items in it.  If the item takes less than 2 minutes I do it immediately, if it takes more it gets clipped into OmniFocus and the email archived or deleted.  You can also improve your spam filters and use smart labeling/smart inbox depending your email setup.  All my inboxes (about half a dozen addresses) forward to a gmail account because I think they are the most versatile provider.  I use Sparrow as a client, but the web interface is fine as well.  Check out the wealth of information including Gmail Ninja.

Ferriss encourages readers to check email only twice a day and then cut down from there: this simply isn't possible in my field.  Ferriss even recommends paying personal assistant services to do things like check email, make basic appointments/decisions, etc.  Assistants aren't really useful for more than business type emails though and as a graduate student I live in the world of mostly non-FAQ style messages. Could I check email less than I do currently? You bet, and I'm working on that.  Checking email the first thing in the morning, while discouraged by many experts is still essential for me.  I want to know what's flying my way for the day that I need to add to the schedule.  Playing with timers that shut down my email for 30-90 minute focus sessions is an experiment I plan to try in the coming year.  (Ferriss would call this a "lifestyle experiment", which is an excellent term in the eyes on an experimentalist.)  Use a stats service to track your email response time, length, thread length, etc.  If you're sending an email every 20 minutes thats in a long thread of long messages just pick-up the phone and call or Skype the parties involved.  I know, I hate phone calls as well, but it saves massive amounts of time.

Further automation (some from Ferriss and some I've picked up) includes Amazon auto shipment of essential items and automatic bill pay.  The automatic shipment of Amazon products on a schedule not only saves me money directly, but time.  I no longer run to at 8:30 pm several times a year to pickup essentials I've forgotten.  Things like deodorant, toilet paper, toothpaste, printer paper, ink, toner, juice, snacks, and just about anything non-perishable can be scheduled to ship at a given interval.  I see the email that a shipment is on the way and leave a note to drop the package at my door instead of the office for the UPS delivery man/woman.  It sounds silly, but it really does save me trips and thinking about repetitive tasks.  Options to request and additional shipment and skip a shipment exists if you over/under estimated how often you use a product.  Automatic bill pay is a similar process: the computer does it and I just supervise by looking at my online banking site every week and noting account action emails. (If you happen to be in the area, PNC bank has great online tools.)

Meetings: Ferriss advises us to avoid these at all costs.  While that may be a good bit of advice, spending time with fellow scientists is how new projects emerge, so cutting isn't as easy as in business.  I do like the idea of having someone requesting a meeting (be it a student or colleague) send some discussion points ahead of time to the group.  This means everyone knows what's on the table and conversation is less likely to drift.  Hit the points, write down new points, but try not to chase them.  Save the idea batting for my favorite meeting idea: agree to meet later for a drink and bring notebooks.  Geologists are famous for their love of beer and having a beer is a relaxed environment that allows ideas to flow onto paper and doesn't eat into the "business hours" of trying to knock off action items.

While there are more points in the book, I want to mention just one more: mini-retirements.  Ferriss says why retire? just take breaks from the work and spread experiences throughout your lifetime.  This is a great idea and very easy to do in academics.  We get mini breaks with semester schedules, but it's not uncommon to go on a research trip or go to a conference overseas and spend an extra week or two.  Several people in our department end up living overseas for months at a time to do their work and get new experiences.  This concept is on my list of experiments to try, but I've noticed working in intense sessions and then really taking small breaks during the day/week has already helped.

In the end, I recommend you read the book.  Maybe grab it from your library and see what you think.  Ferriss seems like a rather abrasive personality, but you don't have to be to adopt a few of the concepts in the book.  It really boils down to the same idea though: make a get of goals, get to them in the best way possible, and don't waste time, recreation or work.

Wednesday, December 26, 2012

Fluxgate Magnetometer Wrap-Up (For now)


Per lots of emails and requests I’m going to post what I have from the design of the fluxgate magnetometer mentioned in several previous posts (like this one).  The schematic attached at the bottom is a rough draft, but should provide some guidelines for designing and building a version of this instrument.  I’ve also attached links to several PDFs that I found very helpful when building this demo.


It should be noted that this design doesn’t have a plain readout with XXXXXX nT magnetic field, but displays a waveform on the oscilloscope.  Could one be made? Absolutely! Since this was more of a demonstration of the underlying physics I didn’t bother, but it would be a good weekend project.

First off let me list a few things I would build differently were I building this again:
-       Use shielded lead wires to reduce crosstalk to the coil.
-       Use a simple Analog-to-Digital converter so this output is projected from a laptop to the classroom screen (much easier than gathering students around an oscilloscope).  I think an Arduino might do the trick.  Raspberry Pi would be a good choice too.
-       Add gain adjustment knobs to the control panel.
-       I would again use the Velleman kit for the signal generator instead of re-designing the wheel.

When using this in the classroom I laid it alongside commercial magnetometers on the table.  We discussed the physical principles behind the instrument, and then students would use the demo fluxgate to generate an output wave.  Afterwards we used the commercial magnetometers to do simple tasks like finding conduits and keys. 

It would also be nice to have a first-principles proton-precession magnetometer.  There is a book “Signals from the Subatomic World: How to Build a Proton PrecessionMagnetometer” that describes one such instrument, but significant improvements in the instrument could be made with modern programming languages and ADC devices. 

I still welcome questions on the fluxgate and will probably update the instrument next time I teach an Intro Geophysics course (undetermined).  Thank you for all the interest and if you build one, please send your results and we’ll put them up here for all to benefit.  

Sunday, October 28, 2012

Fun With Office Supplies - Geometric Cohesion and Staples

After the small rash of tape theft resulting from my suggestion at a talk that the audience go home and unroll scotch tape to see the resulting electrical dischange (which deserves a blog post soon) it's time for another attempt to make Swingline Co. stock soar.

In a recent Physics Today article "Geometric Cohesion in Granular Materials", Scott Franklin of the Rochester Institute of Technology showed some very interesting data regarding how the shape of a material effects how likely it is to stay together as a coherent mass.  Before we delve into the article though, let's talk about cohesion in general.  Then we can come up with a couple of fun experiments that you can do at home.

Cohesion is just the tendency of a material to stick together.  This is different than adhesion though.  Consider a water drop on a dish in your dish drainer.  The water drop is sticking to another material (the ceramic) which is adhesion.  The water drop is also a coherent mass; water molecules are sticking together to form a raised droplet on the surface of the plate.  In essence the water is 'sticking to itself', which is due to electrostatic forces of water being a polar molecule.  Electrostatic forces give water a property of surface tension that causes lots of wonderful things that can make up a whole other post at some point.


Other things can cause a material to stick to itself though.  Remember playing the old pickup sticks game as a kid? The object was to extract a stick from a pile of sticks on the table without disturbing other sticks.  This turns out to be pretty challenging.  Your pile of sticks appeared to be stuck together or interconnected, which is cohesion in a macroscopic or broad sense.  In the case of the sticks electrostatic forces certainly aren't the cause.  Electrostatics forces are relatively weak, and the sticks don't have enough mass for their gravitational attraction to cause this cohesiveness of the pile.  What is the mysterious factor then? It's just their shape. When objects act cohesive because of their geometry or shape it's called geometric cohesion.

First grab a couple of tablespoons of sugar, place it in a small container (an old medicine bottle works great) and turn the container upside down on the table.  Now remove the container... the sugar spreads out in a small pile.  The roughly spherical grains of the sugar don't stick together that well and the pile isn't very tall.  The angle of the pile from horizontal is called the angle of repose, and is around 30-35 degrees for lots of things.  My pile of sugar sat at about 30 degrees.  The angle of repose really tells us how hard it is for the grains to slide past one another.  If it's easy, the pile is a very low angle, and if the pile is made of large, angular hunks of rock, it becomes more steep.


The angle of repose can even be thought of as a proxy for the coefficient of static friction, or how hard it is for the grains to move past each other from a dead stop.  A mathematical relationship can be derived from some geometry, but it turns out the tangent of the angle is about the coefficient of friction. So the tangent of 30 degrees is about 0.6, which is the general number for static friction of lots of materials.  This result means all is well in the world of static newtonian physics and we can think about something more interesting than approximate spheres of sugar.

What about rods? Going back to our game of pickup sticks, the shape of the long, narrow rods seems to be the main factor holding things together.  It's easy for lots of objects to interact and become 'locked together'.  Who cares about rods locking together? Manufacturers often have automated assembly machinery that may have large hoppers of screws, and when things get locked together it costs money.  The long narrow shape of screws can jam hoppers in seconds and hold up the entire line.  While not many people have a pile of tiny screws at home, I bet you have staples.

Staples are a funny shape really.  Standard office staples are about 7mm along the long upper shank and  around 5mm at the two barbs.  These measurements give the staple a barb to shank ratio of about 0.7, which as it turns out, is a governing number describing how well staples can stick together.  Franklin's group did a whole series of experiments with staples of different barb ratios and found that staples with a ratio near 0.4 were the most cohesive.  Even though our staples aren't the ideal ratio let's repeat the sugar experiment.


Using a stapler, eject a bunch of staples into the same container (or one with a slightly larger mouth if you have it).  Now shake the container up for a bit, turn it upside down, and remove the container.  This time the mass didn't spread like the sugar, but retained the relatively sharp edges of the container shape.  Retention of shape tells us that the staples are cohesive, and their high angle of repose means that the coefficient of static friction is very very high.  Franklin's group is currently seeing how strong these piles are by pulling on the ends, but they are actually pretty robust.


The big question is why does any of this matter other than being interesting? Well, cohesion is a big deal when we study soils.  Cohesion can determine if the ground can support a building, if a landslide is due, or if the machine powder coating your morning doughnuts gives you a plain doughnut.  While some of these are more life threatening that others, it's import to study cohesion to keep tabs of impending disasters, especially avalanches and landslides. I know that there aren't that many staples in soils generally, but there are clays which are shaped like plates.  Different minerals/materials in the soil with different shapes can greatly change the strength of the soil and how likely it is to slide as a mass.

Saturday, September 15, 2012

3D Printing in the Lab - Will Lab Hardware Follow Software into Open-Source?


Today I read the article "Building Research Equipment with Free, Open-Source Hardware" by Joshua Pearce from a recent Science Perspectives section.  I'd like to share some thoughts on the article as I thought it introduced what may be the next "want" item in many labs.

In the modern scientific lab there is a large assortment of sophisticated hardware necessary to conduct increasingly complex research.  Generally scientific hardware is some combination of turn-key or off the shelf equipment and equipment designed and built in house.  In recent years laboratory software has progressively become part of the free and open-source software (FOSS) movement; hardware is now following the same trend with the advent of open-source 3D printers from the hobbyist community.

Open-source hardware became popular in the late 90’s with the basic stamp “board of education” microcontroller circuit boards, but the Arduino has taken over the hobby market with its $30 price tag.  Arduino has a number of modules, or shields as they are called, ready built with significant code libraries available.  With the Arduino circuit boards scientists can perform basic hardware control with digital and analog outputs in addition to basic analog-to-digital conversion.  

The RepRap open-source 3D printer is driven by the Arduino and can be constructed for <$1000.  The machine prints the parts required to make another RepRap printer, so building a machine is approached by entering the RepRap community with a parts request.  Users also post 3D designs on Thingiverse for download and printing by anyone.  A sufficient amount of laboratory equipment from test tube racks and filter wheels to Dremel tool adapters are already online.  

Printing laboratory equipment may not only reduce the cost of research, but allow the same flexibility, innovation, and rapid development cycle enjoyed by scientific software.  Being able to create a custom bracket, holder, mold, or sample jig could be advantageous to almost any laboratory and allow research to be conducted more efficiently with less focus on coordinating development with engineers at commercial manufacturers.  The open-source nature of the parts library will reduce duplication of work between those in a common field of research and allow cross-lab standardization of sample preparation techniques.  

There are limitations to what can be easily constructed in the lab, such as 3D printing with metal.  The technology to do this exists, but is too complex and expensive at the present time for individual applications.  While working at Oak Ridge National Laboratory I got the opportunity to see 3D printing with titanium.  The video below is a titanium ball... bouncing. (Apologies for the portrait video and quality, this was taken several years ago with an early iPhone.)


Like all community projects, the RepRap is being updated to have greater capabilities.  According to the project website a major milestone will be printing with electrical conductors to manufacture rapid prototype circuit boards without milling away copper clad board material.  

Just as sometimes labs must use commercial software, it is likewise not expected that all lab hardware will become open source.  Some tolerances are too tight for the parts to be constructed by simple printers and some materials are not practical to print in the lab.  With all this in mind it is worthwhile to monitor the progress of open-source hardware such as the RepRap, Arduino, and the new RaspberryPi single board computer.  These tools may provide teaching support also as controlling and displaying data from classroom demonstrations is easier than ever and does not require the resolution/precision of research grade instruments.

Saturday, September 8, 2012

The Scientific Workspace

Today I'd like to discuss the evolution of the scientific workspace, but before that I need to address a few comments and recent happenings.  The fluxgate magnetometer project is done, I decided to not build a bandpass filter in the unit.  Hopefully I can get the schematic drawn up nicely and post a PDF on my website content section.  Website, oh yes, there is a new website for my academic life.  I'll still be doing blog posts here, but the website will have all my static content, research, etc.


Awhile back I read an interview with Adam Savage of the popular discovery show Mythbusters.  This interview was mostly getting at how Adam works and the productivity tools he utilizes.  The question/answer that caught my attention was the following:


Q: What's your workspace setup like?

A: I have several desks: One at home, one at work, and one in my own shop. I spend little time at any of them. My workplace is wherever I'm making something, which could be in a field in gold country, or in an abandoned warehouse on a military base.

The part of the statement in bold is what I want to discuss.  Scientists are often viewed as working hard in their lab with test tubes, beakers, and bunson burners (as evidenced by a colleague asking his geoscience intro class to draw a scientist on their first day of class).  This view is really valid for only a small sector of the sciences; as geologists we are often making a workspace in the field on an outcrop of rock, working on a laptop in the office or at a coffee shop, or doing an experiment in the lab. So what is the workspace and how has it changed? 


First: Do people (not just scientists or geologists) view the workspace differently than they did in the 1960's? I think so.  With the advent of mobile computing and being able to walk around with 1000+ PDF files and books on an iPad the office is becoming less and less important.  Until the late 90's the office was the place where all your paper lived, without this support it was impossible to do much work.  Now that this isn't the case, I believe the office is becoming occupied more infrequently and being replaced with the mobile office.  The internet is also making telecommuting easier each year.  While in Houston I could occasionally see updates to spacecraft flight software coming into the repository from a colleague who programed at a Starbucks frequently.   Just a few years ago that was impossible and during the Apollo days out of the question.


Next, can the creative (yes, scientists are creatives that won't admit it) work in a single workspace like an office or lab? While they could this is a severely limiting strategy.  There are several times I've found it useful to go into the shop or lab and tinker with things and setup a laptop and work there.  Sometimes I spend the majority of the week at the desk, but sometimes I'll setup for a paper reading or programming marathon in another building or at a restaurant.  


Why would you want to work somewhere that doesn't have the big monitor and files you enjoy at your desk? Chance encounters.  While working in the traditional office should still be a component of our days, some of the most useful conversations I've had occurred with people in other buildings on campus or at a coffee shop.  

For example: in December of last year I was working in a tea shop near Denver programming an image analysis code (for the laser cave mapper).  While coding away the owner of the shop (Damon) came over to refill my glass and noticed I was writing software on a Mac.  He inquired about what I did, asked if I could answer a Mac question for him, and then from the view of an outsider to the geosciences made a comment that ended up making me think a lot about other applications for this technology.  These kind of chance encounters have happened several times and even ended up in some good professional relationships being formed.


The physics rock star Richard Feynman would have loved this notion of many workspaces I believe.  Feynman loved new ways to look at things and could be looking at a complex problem from a new angle while in the outdoors, at a blackboard, or submerged in a tub of water on hallucinogenic drugs (to see Feynman's unique mind I highly suggest his book Surely You're Joking Mr. Feynman).  


I suppose the biggest point I want to make with these examples and from the quote is that as scientists it's easy to get comfy in our office surrounded by a couple of giant computer screens and full of distractions.  We shouldn't throw that office out, but be sure to go into the lab (even if you're not an experimentalist) and tinker, go into the field and observe connections, or go to a coffee shop and make that a temporary office.  Anywhere can be your workspace and it's enriching to switch between them and look at the same problem with another set of tools and surroundings. 


Sunday, June 10, 2012

Teaching Field Camp - Starry Nights

The geophysics students have given their final presentations and gone home.  I'll be finishing up a couple of posts (mostly waiting on graphics) about their last weeks of work and a few interesting study areas, but for now we will break from geology.  The geologists will be doing geophysics for the next few days (hence I'll still be in Cañon City), but now I'll have slightly more free time to do some photo experiments!

Saturday night another TA rushed in to tell me that the milky way was out and nicely visible.  I grabbed my camera, but sadly the moon was rising and it was hard to get great shots.  The wind was gusty, but a moon shot turned out okay, and we staged a photo with the dining hall, OU vans, and star trails.  Look for more geology posts in the next few days before I depart for my desert loop on the way to Arkansas.


Saturday, June 2, 2012

Teaching Field Camp Week 2 - Ground Penetrating Radar

Week 2 of camp for the geophysics students was at the new University of Oklahoma Bartell Field Camp. Students were split into three groups and each group rotated through three main geophysical methods: gravity, magnetics, and ground penetrating radar (GPR).  I was responsible for the GPR all week, but we'll briefly discuss everything they did and some problems we had along the way.

Monday the students went on an intro field trip to learn about the geology of the area.  First students walked up the road to 'high camp' noting the sediment basement contact (and what we interpret as a large fault breccia) on the way.  When into the granitic basement there are many mafic dikes, some locations even have dikes crosscut by later intrusions.  The students this year really seemed well prepared to tie the geology into their reports and were very careful in noting/interpreting features.  Next we drove to Tunnel Drive, a short hike that exposes lots of basement deformation and some classic fault examples.  There were also a couple fun stops like Skyline Drive where dinosaur footprints have been preserved as trace fossils.  In the picture below we are looking up at the bottom on an impression likely left by a foot of an ankylosaurus.


The next three days the groups rotated through the geophysical methods.  In this post I'm only going to discuss the GPR collection and data.  The gravity data is currently being processed (so expect a post about it early next week) and the magnetics are posing problems.  Our main magnetometer has an internal problem that prevents us from downloading the data collected.  It is being sent back to the factory and the students will collect new data with an older system next week.  There is also a special magnetic surprise I found in an outcrop that I want to discuss in a more detailed post.

Ground penetrating radar is a technique we haven't really used much recently at OU, but I'm hoping to make a come back with it! The system needed lots of tweaking, adjusting parameters, and fiddling with; after that it obtained some really interesting data.  A ground penetrating radar sends a signal into the rock, which is reflected from various objects/interfaces, so data is interpreted similar to seismic data (only at a different time scale).  Seismic waves travel through rock at around 2200km/second while radar waves are much faster at about 0.1m/nanosecond.  GPR is used extensively in archeology to look for near surface targets and to find bodies during criminal investigations (we have in fact used this system over a mass grave before in Norman... but that's another post all together).

The first day we had students experiment with different parameters over a known target (a metal culvert under a road).  While the target isn't necessarily geologic, we know what it is, where it is, and how big it is.  Using this we setup an ideal parameter set to then examine more interesting geologic features.  Other groups during the week also targeted the culvert for practice, then picked more interesting areas to examine.

First I had to patch together some codes to convert the GPR data from the proprietary DT1 format to a more standard SEGY format.  We then worked up some seismic unix command flows to process that data.  The images shown are not migrated and could benefit from migration, spiking deconvolution, etc.

The first image shown is on the high camp road.  There was a culvert near the surface, but below that are other diffractions from some interesting geological structures.  I'll currently not say any more so students can think about what these are.  The second image shows why this tool could be so valuable.  There was little geology at the surface, but according to the data there is a dipping reflector just under our feet.  What could it be? Maybe with a few more trips up there I'll be able to find it in outcrop somewhere.  There were also some diffractions deeper in this image.  While I do have lots of comments about the GPR parameters, setup, etc I don't think it's so important to discuss.  My goal is to show that there is so much beauty in the complexity of what happened here.  The basement rock is very very old (without an extensive literature search we'll say pre-cambrian, which is ~540 Million years ago).

Friday we took the students on another field trip.  Early in the morning I had to take our other TA, Cullen Hogan, to the airport.  He is leaving us for an internship and will be greatly missed in the last week of the course.  After returning from the Colorado Springs airport the students piled in to drive to one of my favorite views in southern Colorado, Spiral Drive in Salida.  On the way to Salida from Cañon City small sedimentary 'hanging basins' can be found in the mountain sides as we drive through a thrust zone between sediment and basement.  Salida lies in the San Lúis Valley, part of the slow Rio Grande Rift.  The view is always amazing and some complex geology is observed on the way.  Below is a panorama overlooking the collegate peaks I took at this location last year (there wasn't as much snow this time).


Sunday, May 27, 2012

Teaching Field Camp Week 1 - Norman, OK

For the next 3.5 weeks I'll be a teaching assistant for the University of Oklahoma geophysics field camp.  The point of the camp is to teach senior geophysics students how field data is collected, processed, interpreted, and applied to the problem.  This is an important capstone class because prior to now students just see geophysical data as equations, numbers, and options in software and on paper.  Now they must hike in the field, observe the geology, collect the data, and finally figure out what it all means.

Week 1 was done in Norman, OK back at the school.  Monday the students listened to lecture on geophysical methods, were introduced to the equipment, and finally were tasked with using differential GPS on the North Oval of campus.  Differential GPS is much more sophisticated than the GPS in your car.  Each unit costs ~$80,000, and one is mounted on a tripod and remains stationary throughout the day.  This station is referred to as the base, and is the most crucial link in any geophysical survey.  The second station is mounted in a backpack and is the rover.  Students walk around with the rover collecting data points, then at the end of the day the base station is used to calibrate the rover data.  We know the base station doesn't move during the day, but it appears to in the data.  This is because GPS locations are highly susceptible to changes in atmospheric humidity, irregularities in the satellite orbits, and a number of other factors.  Without going into more detail, look below at the Excel plot of the oval before and after correction.  Data points are much closer (within centimeters) after correction, and those centimeters make all the difference in some survey environments.  This plot came from one of our students reports that was turned in during the week.

The next objective was to collect a seismic line over a branch of the fault system that slipped during the earthquake sequence of November 2011 in central Oklahoma.  Setting out a seismic line is a long, arduous task, so the students needed a practice day.  We setup a short (~300m) line by the school's duck pond.  Below is a time-lapse video I took of the practice session on Tuesday.


The next two days were collecting the real data in Prague, OK with Friday reserved for processing.  Without going into great detail of how we setup and collected that data I'll say that 72 geophones were deployed every 10m.  Geophones are small seismometers effectively that only measure the motion of the ground in one direction (up and down in this case).  After processing the data we get an 'image' of what's going on underground.  Are the rocks bent (folded), broken (faulted), or otherwise layered/interesting.  We expected to cross the branch of the fault responsible for some of the stronger aftershocks.

Below are some of the processed images from a student.  This is a rough processing and can be improved with more time, but that is beyond the scope of what is expected in the field.  The faults are marked by yellow lines and indicated places were the rock has broken and slipped.  Also notice the folded layers to the left of the section.  More work and interpretation is needed to obtain further geologically useful interpretations.


Expect more posts as we re-group in Cañon City, CO and begin working on gravity, magnetics, and ground penetrating radar.